


 April 28, 2020

SAS Visual Analytics Interview Question and Answer
Question No.1
Which tab is used in SAS Visual Data Builder to subset data
on calculated columns that appears in the output tables?
A) Where Tab
B) Joins Tab
C) Output columns Tab
D) Having
Tab
Answer: D
Question No.2
The content developer has just
changed the filter to add more data to this line chart in SAS visual analytics
Explorer, are some of line outside of view?

A)
The data does not fit
B)
Data outside of the can be ignored
C)
There is too much data for line chart
D)
The vertical axis is locked
Answer: A
Question No. 3
There are two
visualization are given in the area:

When a bar is
selected in the bar chart, the makers in the scatter plot that correspond to
selected value in the bar area are highlighted. This feature used in SAS Visual
Analytics Explorer called:
A)
Report level display rules
B)
Data Brushing
C)
Conditional Highlighting
D)
File interaction
Answer: B
Question No. 4
A content developer
has created an exploration in SAS Visual Analytics Explorer with a large number
of visualization. How can the developer manipulate the display of the visualizations.
A)
Minimize visualization to the dock pane
B)
Mark visualization as hidden from the properties
tab
C)
Changes the size of the visualization from the
view menu
D)
Overlap the visualization with precision layout.
Answer: A
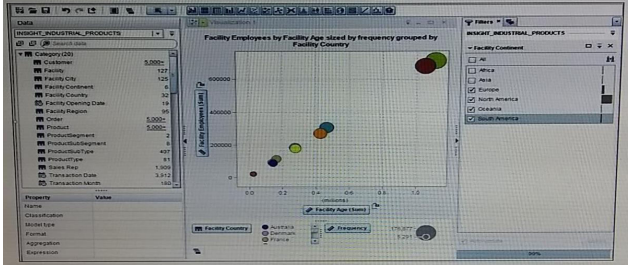
Question No. 5
Which method
does the content developer use to change visualization1 to visualization 2.
A)
Change the scale on the Y axis
B)
Reduce the number of bins
C)
Remove data source filter
D)
Edit measure facility Age to have only one
decimal point
Refer to the
exhibit shown:
Two vertical
bar chart are shown, first thin lines and the next thick bars.

Answer: B
Question No. 6
Refer the
exhibit below, USA map shown:

What must a
content developer do to create this chart using automatic chart visualization (Choose
Three).
A)
Select the geo map visualization
B)
Hold down the ctrl key and drag location hierarchy,
unit age and product sale on the workspace.
C)
Hold down the ctrl key and drag continent,
country, state, and unit age and product sale on the workspace.
D)
Specify the continent, country, and state as
geometry date items
E)
Create the location hierarchy that uses
continent, country, and state geography data items.
Answer: B, D, E
Question: 7
SAS Visual
Analytics assign colors dynamically to category values to grouped
visualizations. How would a content developer specify a specific color for
category values?
A)
Right-click on category item from the Data pane
and select new custom category.
B)
Right-click on category item from the Data pane
and select colors.
C)
Change
the grouping style on the properties tab in the right pane
D)
Define a color mapped value display rule for the
category data item.
Answer: B
Question: 8
A new calculated
item created in SAS Visual Analytics Explorer is based on which type of data?
A)
Normalized
B)
Unaggregated
C)
Grouped
D)
Aggregated
Answer: B
Question: 9
How can SAS
LASR analytic server libraries be used in SAS Visual Data Builder?
A)
As staging libraries
B)
As output only libraries
C)
As input and output libraries
D)
As input only libraries
Answer: C
Question: 10
How many data
source can each report section have in SAS Visual Analytics Designer?
A)
1
B)
250
C)
It is determined by the preferences
D)
Unlimited
Answer: C
Question: 11
Refer the exhibit
below:

How does the
content developer create the facility (Distinct Count) data item?
A)
Change the classification property of facility
content to distinct count measure
B)
Change the aggregation of facility to Distinct
Count
C)
Create a new custom category that display the
distinct count
D)
Right-click on Facility and select create Distinct
Count
Answer: D
Question: 12
Which statement
is true when importing an excel file with multiple work sheet into SAS Visual
Analytics Designer
A)
Only one worksheet can be imported at a time
from excel file with multiple worksheets
B)
All
selected worksheet are imported as separated tables
C)
You can import excel file with multiple work
sheet
D)
All selected worksheet imported and concatenated
together
Answer: B
Question: 13
A content developer
imports the following three data source into the exploration
·
Information about company finance
·
Information about product sales
·
Information about industry sales
Refer the below exhibit, how many
data source must the content developer use to create visualization 1?
Answer: 1
Question: 14
In SAS Visual
Analytics Designer, which part of user interface allow you to change the
classification property of a data item.
A)
Select option on the data tab, and select Data
Properties
B)
Right click on the data item
C)
Roles tab in the right pane
D)
Select option on a date tab, and select measure
details.
Answer: A
Question: 15
Refer to the exhibit below:
Assuming that there are data
value for each city, how many different labels will be displayed when using
this data item?
A) 2
B) 3
C) 6
D) 7

Answer: B
Question: 16
How does a content developer
determine whether the value of a measure data item are unique.
A) Display
the data item properties of the measure to determine if the measure is unique
B) Open
the data source details windows, and compare total row and returned rows.
C) Open
the measure detail window, and compare the total rows and distinct count
statistic.
D) Open
the data properties window, and compare the aggregations.
Answer: C
Question: 17
Refer the bubble plot from SAS
Visual Analytics Designer:
How have data item been assigned to roles for this bubble plot?
A) A
hierarchy data items has been assigned to the group role and an expression
display rule has been applied to the background
B) A
category data item has been assigned to
color role and data item formatted with MMDDYYYY has been assigned to the
animation role
C) Custom
category data item has been assigned to the group role and a data item name profit has been assigned to the size role
D) A reference line has been set for less than 35,000 and a hierarchy has been assigned to the color role.
D) A reference line has been set for less than 35,000 and a hierarchy has been assigned to the color role.

Answer: A
Question: 18
Refer to the bar chart from SAS
Visual Analytics designer

How are data items assigned to
the roles for this bar chart?
A)
A hierarchy date item is assigned to the
category role and a category date item is assigned to the group role.
B)
To measure data items are assigned to the
measure role and a category data item is assigned to group role.
C)
A hierarchy data items is assigned to the category
role and a category date item is assigned to the lattice columns.
D)
A hierarchy data items is assigned to the group
role and a date time data item is
assigned to the animation role.
Answer: C
Question: 19
Why are the interval value cell grayed out?
A)
You must use shared rule to edit the value
B)
Once interval value are created they cannot be
edited
C)
You must select the row before it comes editable
D)
You do not have permission to edit the report

Answer: A
Question: 20
Refer the exhibit the below
When creating the report in SAS Visual Analytics Designer ,
Which tab do you use to change the values displayed in the parenthesis?
A)
Ranks
B)
Objects
C)
Roles
D)
Properties
Answer: D
https://medium.com/@soma.das9010/sas-visual-analytics-interview-question-and-answer-5973bdf6b3b5
 Posted in:

0 comments:
Post a Comment